
Forage Production
Forage Production
-
Has been used as a high quality annual forage in Europe for centuries.
-
Management guidelines as a dual-purpose crop are non-existent at this time.
- Very limited research has been done on dual-purpose forage/seed crop in the Great Plains. Early results are promising.
- Canola is slightly lower than wheat in protein, lower in fiber, and higher in energy.
- Canola forage should be treated more as a concentrate than a forage crop.
- Canola should make up no more than 75% of the ration with the other 25% made up of a high fiber hay.
- Requires a few days for cattle to develop a taste for canola forage.
- Canola field should be stocked when canopy height is about 6 to 8" tall.
- Stocking rate should be adjusted so that new growth is consumed.
- One-third to one-half of the original forage should be remaining when cattle are removed. Cattle will grub it to the ground if allowed.
- Better utilization of the crop to stock with calves than older cows.
- With proper management high quality fall/early winter pasture, along with a good seed crop should be obtainable.
Canola Forage Production
-
Canola leaf blades have much lower nitrate than that in the petiole. Nitrate concentration decreases from the bottom up.
- Data to date suggest that potential nitrate toxicity due to grazing canola may be manageable by limiting fall nitrogen applications to the recommended 1/3 of the amount required for the crop.
- A soil sample must be taken and the amount of available nitrogen needs to be taken in to consideration for the 1/3 needed in the crop.
- By removing cattle before they begin eating the leaf petioles, and/or by carefully monitoring cattle grazing canola during cloudy weather.
- Remember that canola forage should be treated as a concentrate, not a roughage, and free choice low quality dry roughage should be provided to cattle grazing canola.
- Make sure cattle are full with lower quality forage before releasing on to canola.
Forage and Feed
-
Winter canola's abundant fall and early spring growth makes excellent forage during these periods. Livestock adjust to canola forage by mixing the feed rations over a 7 -10 day period. This adjustment helps preventing bloating and other diseases.
- I the spring, haying of winter canola should occur before it flowers (similar to alfalfa). The use of canola or high moisture silage may allow the grower to keep it longer due to canola's inherently high moisture content. Forage yield trials in Idaho and Montana have had recorded yields of 2-13 tons per acre.
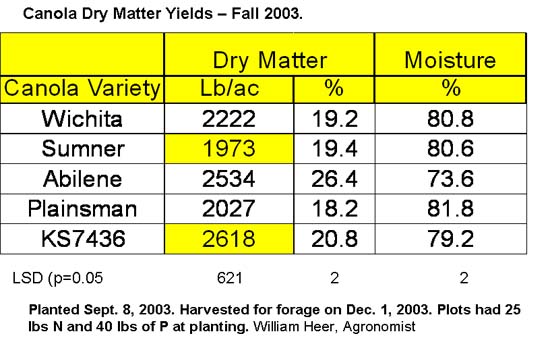
2003 - 2004 Canola for Forage
Kansas State University
Hutchinson, KS.
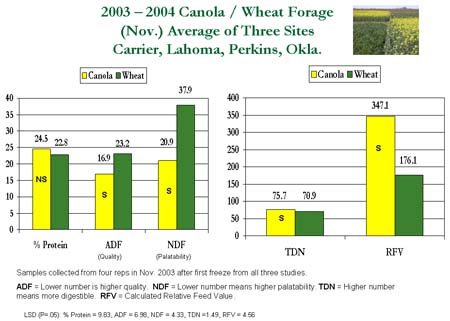
2003 - 2004 Canola / Wheat Forage
(Nov.) Average of three Sites
Carrier, Lahoma, Perkins, Okla.
Watch Canola Nitrate Closely before Grazing
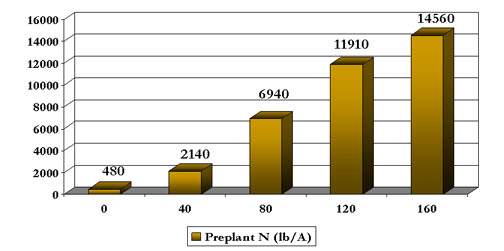
Relationship between canola leaf nitrate concentration and pre-plant nitrogen application. Sampled December 16, 2004 from Canola Fertility Trial, Northcentral Research Station, Lahoma.